Graphviz
概述
Graphviz 是一个开源的, 跨平台的自动绘图工具.
Graphviz 主要用于绘制关系图, 与 Visio 类似, 但 Visio 使用的是图形操作界面, 而 Graphviz 则使用代码, 只要告诉 Graphviz 这张图包含哪些元素, 以及这些元素之间的关系, Graphviz 就可以自动画出来.
与 Visio 相比, 其优点在于: 图形是自动绘制的, 如果关系非常复杂, 使用 Visio 比较繁琐, 而 Graphviz 可以自动布局, 它可以尽量让关系之间的连线的交叉尽量少.
安装
Ubuntu:
sudo apt-get install graphviz
编译
dot -Tpng test.dot -o test.png  # 生成 png 图片
eog test.png  # 查看图片
除了 png 图片, 还支持:
jpg, gif, bmp, tiff, ico, svg
pdf, eps, ps
DOT 语言
Graphviz 根据 DOT 语言的描述来自动生成图形.
DOT 包含三个基本元素: node, edge, graph. 这三种元素都有一些属性, 如颜色, 形状等.
DOT 支持有向图和无向图两种.
无向图例子
graph simple
{
    a -- b -- c;
    b -- d;
}
有向图例子
digraph simple
{
    a -> b -> c;
    b -> d;
}
注释
单行注释: //
多行注释: * *
node
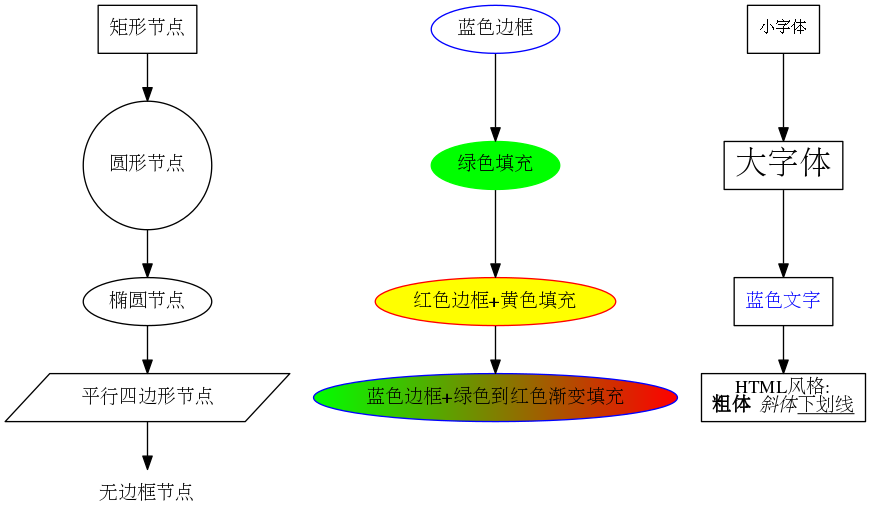
node 常用属性: label(标题), color(颜色), style(样式), shape(形状)
更多属性, 可以参考文档
digraph node_attr
{
    shape1 [shape=box, label="矩形节点"];
    shape2 [shape=circle, label="圆形节点"];
    shape3 [shape=ellipse, label="椭圆形节点"];
    shape4 [shape=polygon, sides=4, skew=0.4, label="平行四边形节点"];
    shape5 [shape=none, label="无边框节点"];
    shape1 -> shape2 -> shape3 -> shape4 -> shape5

    color1 [color="blue", label="蓝色边框"]
    color2 [color="green", style=filled, label="绿色填充"]
    color3 [color="#ff0000", style=filled, fillcolor="yellow", label="红色边框+黄色填充"]
    color4 [color="#0000FF" style=filled, fillcolor="green:red", label="蓝色边框+从绿色到红色渐变填充"]
    /* 上面两个节点采用 HTML 的颜色语法,dot 支持 这种语法 */
    color1 -> color2 -> color3 -> color4

    text1 [shape=box, fontsize=12, label="小字体"]
    text2 [shape=box, fontsize=24, label="大字体"]
    text3 [shape=box, fontcolor="blue", label="蓝色文字"]
    text4 [shape=box, label=<<b>粗体</b> <i>斜体</i><u>下划线</u>>]
    // 注意:text4 使用 HTML 风格的 label,无需引号,但必须用尖括号
    text1 -> text2 -> text3 -> text4
}
结果如下:
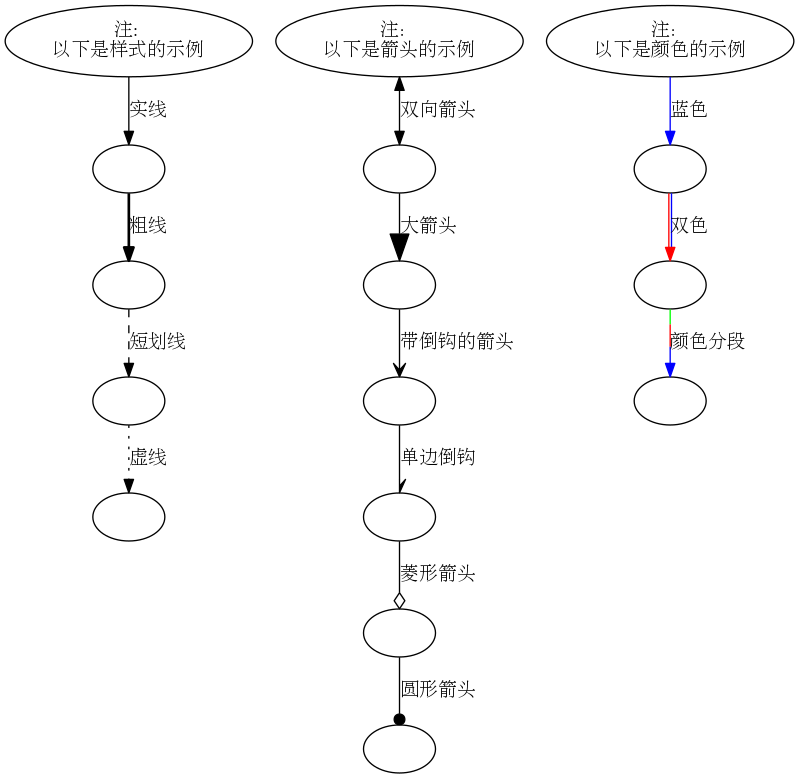
edge
有向图用 ->
无向图用 --
属性:
label: 标题
color: 颜色
style: 线条的样式
dir: 连线的方向
arrowhead: 前端样式
arrowtall: 末端样式
例子:
digraph edge_attr
{
    style0[label="以下是样式的示例"];
    style1[label=""] style2[label=""] style3[label=""] style4[label=""];

    style0 -> style1 [style=solid, label="实线"];
    style1 -> style2 [style=bold, label="粗线"];
    style2 -> style3 [style=dashed, label="短划线"];
    style3 -> style4 [style=dotted, label="虚线"];

    arrow0[label="以下是箭头的示例"];
    arrow1[label=""] arrow2[label=""] arrow3[label=""] arrow4[label=""] arrow5[label=""] arrow6[label=""];
    arrow0 -> arrow1 [dir=both, label="双向箭头"];
    arrow1 -> arrow2 [arrowsize=2.0, label="大箭头"];
    arrow2 -> arrow3 [arrowhead="open", label="带倒钩的箭头"];
    arrow3 -> arrow4 [arrowhead="halfopen", label="单边倒钩"];
    arrow4 -> arrow5 [arrowhead="ediamond", label="菱形箭头"];
    arrow5 -> arrow6 [arrowhead="dot", label="圆形箭头"];

    color0[label="以下是颜色的示例"];
    color1[label=""] color2[label=""] color3[label=""];
    color0 -> color1 [color="blue", label="蓝色"];
    color1 -> color2 [color="red:blue", label="双色"];
    color2 -> color3 [color="green:red;0.4:blue", label="颜色分段"];
}
结果如下:
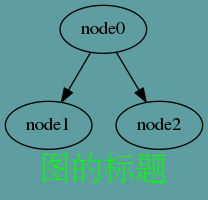
graph
属性:
label: 标题
bgcolor: 颜色
fontname: 字体名称
fontsize: 字体大小
fontcolor: 字体颜色
center: 是否居中
例子:
digraph graph_attr
{
    graph[bgcolor="cadetblue" label="图的标题" fontsize=24 fontcolor="green"];

    node0 -> node1;
    node0 -> node2;
}
结果如下:
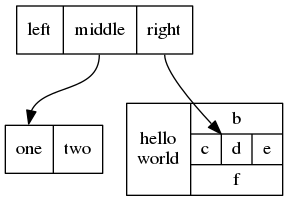
更复杂的例子
digraph struct
{
    node [shape=record];
    struct1 [label="<f0>left|<f1>middle|<f2>right"];
    struct2 [label="<f0>one|<f1>two"];
    struct3 [label="hello\nworld|{b|{c|<here>d|e}|f}"];
    struct1:f1 -> struct2:f0;
    struct1:f2 -> struct3:here;
}
结果如下:
指定位置
digraph simple {
        A [shape=circle, label="A", pos="10,10!"]
        B [pos="0,0!"]
}
编译:
dot -Kfdp -n -Tpng -o test.png test.dot
或
neato -Tpng test.dot -o test.png
如果指定参数: -Gsplines=true 则表示在必要的情况下, 使用曲线连接.
Generated by Emacs 25.x(Org mode 8.x)
Copyright © 2014 - Pinvon - Powered by EGO
